
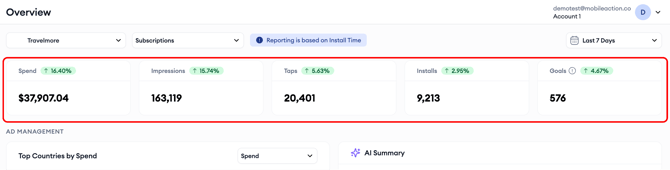
The Metric Summary section at the top of Overview shows five summary cards highlighting your key performance indicators for the selected campaign group, app, goal, and date range. This article explains what each metric measures and how to interpret the data shown alongside it.
Available metrics
|
Metric |
What it measures |
|
Spend |
The total amount spent on your Apple Ads campaigns during the selected period. |
|
Impressions |
The number of times your ads were shown to users during the selected period. |
|
Taps |
The number of times users tapped on your ads during the selected period. |
|
Installs |
The total number of app installs attributed to your Apple Ads campaigns during the selected period. |
|
Goals |
The number of in-app events attributed to your campaigns for the selected Goal during the selected period. Available when a Goal is selected from the Goal filter. |
What each card shows
- Current value: Calculated based on the selected date range.
- Period-over-period change: The percentage change compared to the previous equivalent period.
- Performance indicator: A color indicator that highlights whether the metric has increased or decreased compared to the previous period.
How to read the percentage change figures
The percentage change figure shows the difference between the selected period and the equivalent previous period. A green percentage means the metric improved compared to the previous period. A red percentage means it declined. The direction of improvement depends on the metric: for spend, a decrease is generally positive, while for installs and taps, an increase is generally positive.
The previous period is always the same length as the selected period. For example:
- If you select Last 7 Days, the comparison is against the 7 days before that.
- If you select Last 14 Days, the comparison is against the 14 days before that.
- If you select Last 28 Days, the comparison is against the 28 days before that.
Pro tip: Use the percentage change figures alongside absolute values, not in isolation. A large percentage increase in installs means less if the absolute number is still very low. Always check both figures together to get an accurate picture of performance.
Goals card states
The Goals card changes depending on your setup:
- If no Goal is selected, the Goals card prompts you to select one.
- If your account only has an Apple Ads integration, the Goals card is replaced with a call to action to connect an MMP.
Related links
Need more help?
If you have further questions, contact your dedicated Customer Success Manager or reach out via live chat.