Report By Ranking in ASO Report shows how your app's keywords are distributed across position bands over time. It is the default view when you open ASO Report and gives you the clearest signal of whether your overall ranking health is improving or declining.
To understand which keyword pool to use before you start, see Understand Tracked Keywords and All Ranked Keywords.
What you see in Report by Ranking
The view has two components side by side.
The Ranking Graph on the left is a stacked area chart. Each colored band represents a position group: rank 1 (blue), 2–3 (green), 4–10 (purple), 11–30 (orange), 31–100 (yellow), and 101+ (red).
The left axis shows the number of keywords in each band. The black line running across the chart is your Visibility Score, plotted against the right axis.
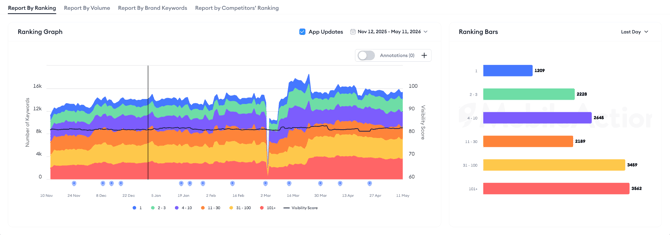
The Ranking Bars on the right show a snapshot of how many keywords sit in each position band at a specific point in time.
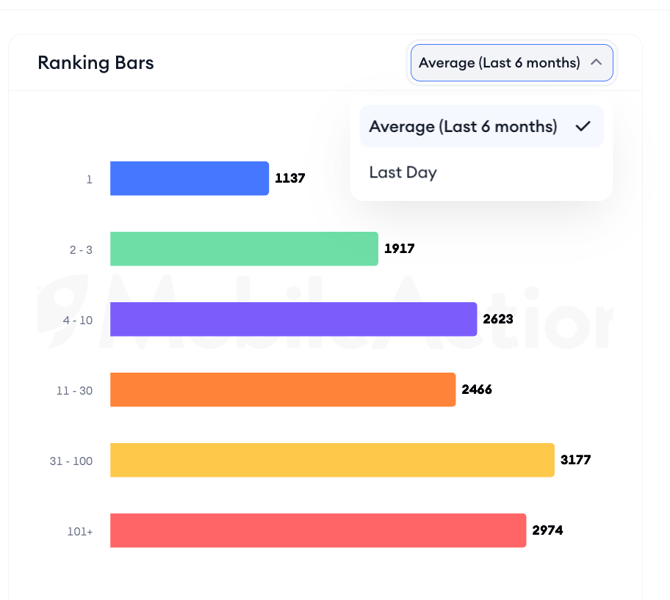
The dropdown above the bars lets you switch between Last Day and Average (Last 6 months). Last Day shows your most recent rankings. Average (Last 6 months) smooths out daily noise and gives you a broader trend view.
Using the chart controls
The App Updates toggle overlays your app's release dates as markers on the chart. Enabling it lets you correlate ranking shifts with version updates, if a band narrows or widens after a release date, that is a signal worth investigating.
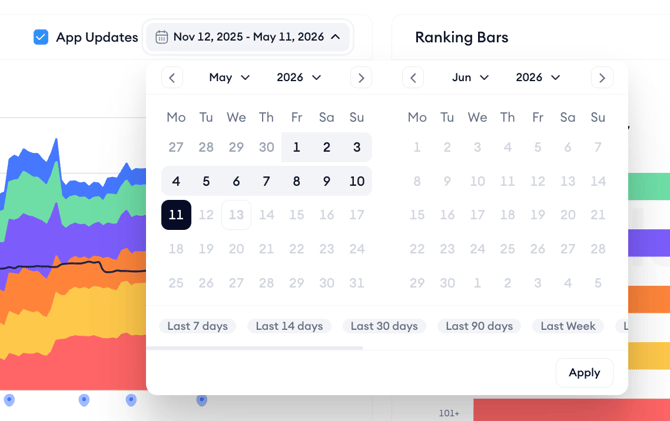
The date range picker controls the period shown in the chart. You can set a custom range or use the presets. A longer range is useful for spotting long-term trends; a shorter range helps you focus on the impact of a recent change.
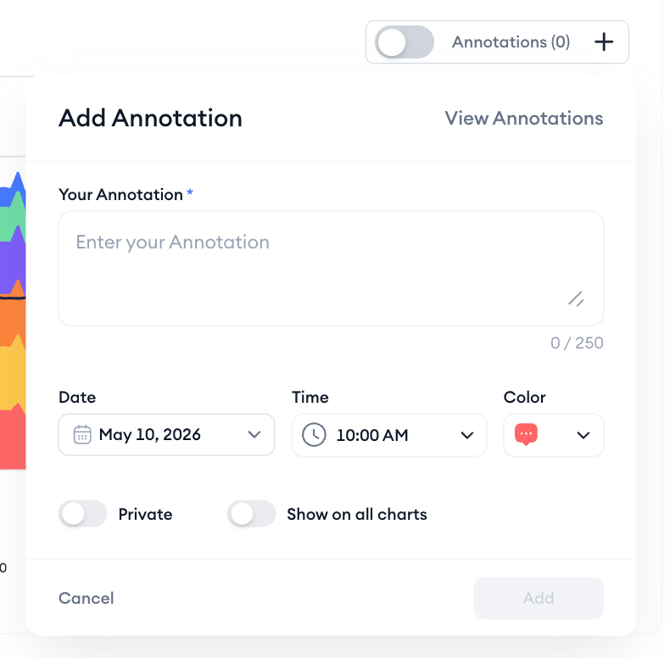
The Annotations toggle shows or hides any annotations you or your team have added to the chart. Click the + button next to Annotations to add a new one. Each annotation requires a date, time, and a short label up to 250 characters. You can mark it as private (visible only to you) or use Show on all charts to display it across every chart in ASO Report for the same app.
Reading the keyword table
Below the chart, the keyword table lists every keyword in the selected pool with supporting metrics. Each row shows the keyword, its Type tag, Volume, Max Reach, Conversion Rate, Installs, Chance, and Ranked Apps.
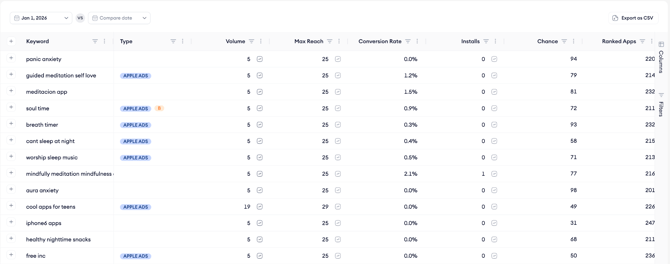
The Type column uses tags to classify keywords. Apple Ads indicates the keyword is running in an active Apple Ads campaign. B marks brand keywords. M marks metadata keywords; terms that appear in your app's title, subtitle, or keyword field.
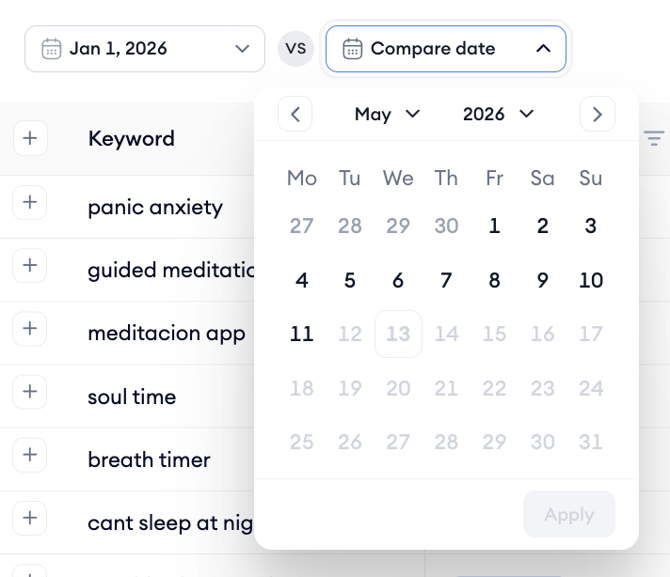
Each metric cell has a small icon that opens a popup explaining what that metric measures and how to interpret it. The date picker above the table sets the date for the data shown. The Compare date option adds a second date column so you can see how each metric has changed between two points in time.
Click Columns on the right edge of the table to show or hide columns. Click Filters to narrow the table by keyword type, volume range, ranking band, or other criteria.
After you finish
If you notice a ranking band shrinking (particularly the 1–10 range) cross-reference the change against the App Updates timeline to see whether a version release preceded the shift.
If you find keywords in the 101+ band that you are not currently tracking, use the + button in the table to add them to Keyword Tracking and monitor whether they recover.
Related links
Understand Tracked Keywords and All Ranked Keywords
Analyze keyword performance by volume
Review brand keyword performance
Compare keyword rankings against competitors
Export and share ASO Report data
Need more help?
If you have further questions on the process, contact your dedicated Customer Success Manager or contact the support team via live chat.