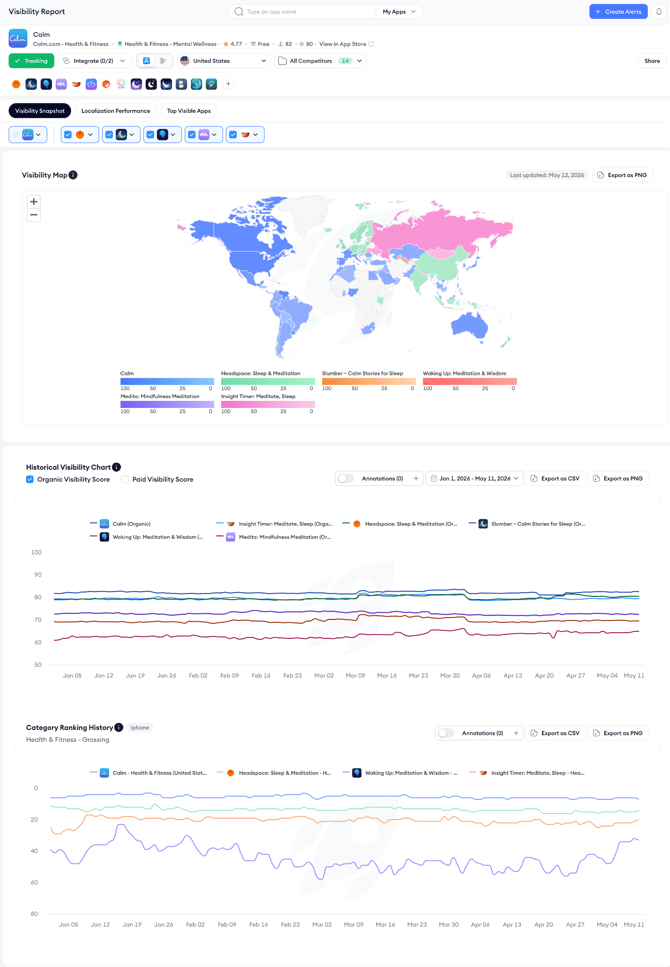
The Visibility Snapshot tab in Visibility Report gives you a cross-storefront view of your app's current visibility position. It combines three sections (the Visibility Map, the Historical Visibility Chart, and the Category Ranking History) into a single view so you can assess your organic presence, track score changes over time, and monitor category position without switching between tabs.
To understand what the Organic and Paid Visibility Scores represent, see About Visibility Report.
Before you start
The Visibility Report opens on the Visibility Snapshot tab by default with your own app selected. You can compare up to five competitors using the competitor chip row below the app header.
Each chip represents a competitor app. Select the ones you want to include and all three sections update to show their data alongside yours.
The country selector in the app header controls which storefront's data is shown across the entire Visibility Snapshot tab.
Visibility Map
The Visibility Map is a world map that displays each country's Organic Visibility Score for all selected apps.
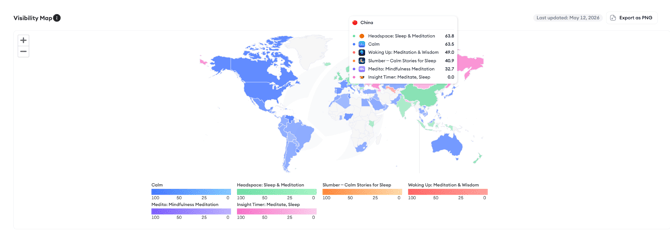
Each app is assigned a color, shown in the legend below the map. The shade intensity on the map reflects score strength; darker shades indicate higher visibility in that market.
Hovering over any country opens a tooltip showing the visibility score for each selected app in that storefront side by side. This makes it straightforward to spot markets where competitors are outperforming you or where your own visibility is unexpectedly low.
The map refreshes daily. The Last updated date in the top right of the map section shows when the data was last refreshed. Click Export as PNG to download the current map view for presentations or reports.
Historical Visibility Chart
The Historical Visibility Chart shows how visibility scores have changed over time for your app and all selected competitors. Each app appears as a line on the chart.
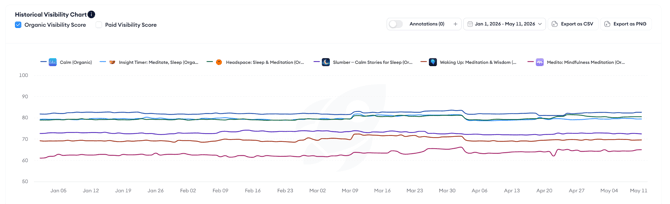
Use the Organic Visibility Score and Paid Visibility Score toggles above the chart to switch between the two score types. Both can be enabled at the same time if you want to compare organic and paid visibility trends in the same view.
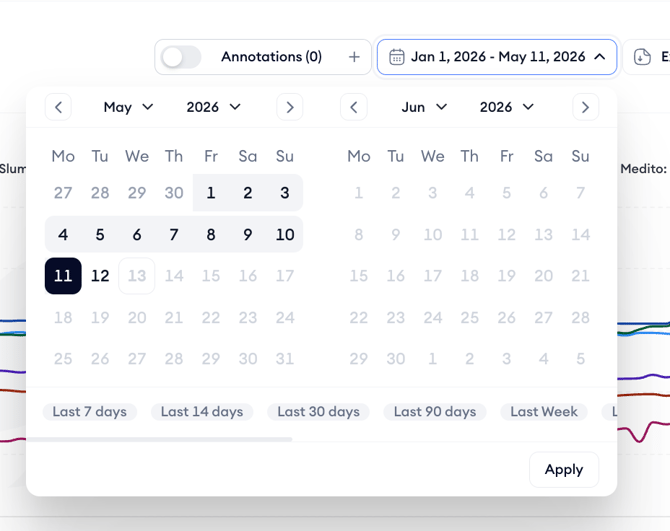
The date range picker controls the period shown.
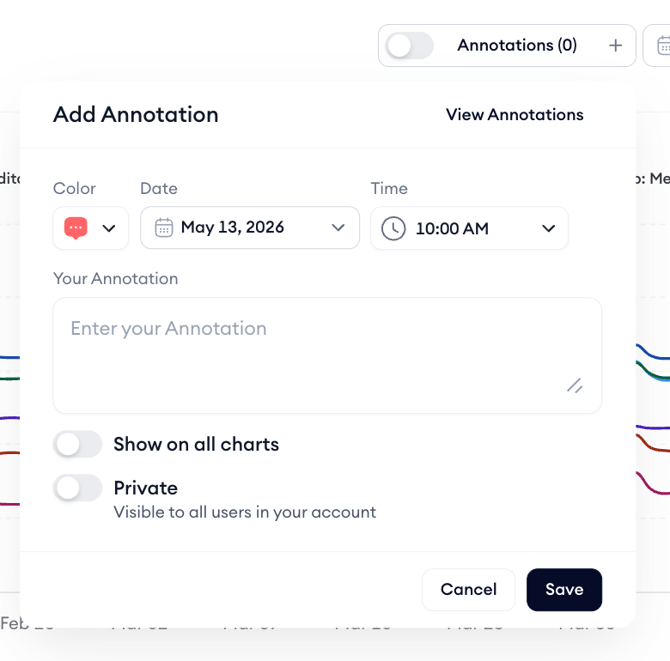
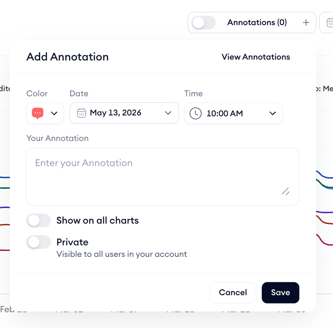
Use the Annotations toggle to show or hide annotations on the chart. Click the + button to add a new annotation, annotations added here follow the same rules as in ASO Report: any team member can add one, annotations can be marked as private, and the Show on all charts option displays them across other charts in the tool.
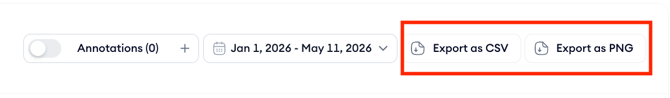
Click Export as CSV to download the underlying score data, or Export as PNG to save the chart as an image.
Category Ranking History
Category Ranking History shows how your app's position within its App Store category has changed over time, plotted against the same competitors shown in the rest of the Visibility Snapshot tab.
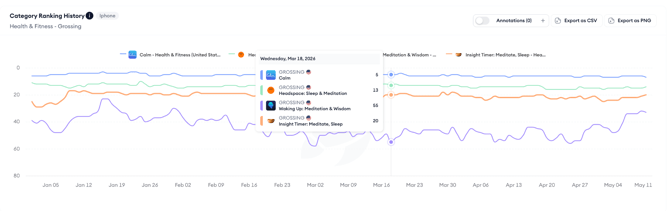
The chart shows category rank on the vertical axis, lower numbers are better. Each app appears as a line.
Use this chart to check whether visibility score changes are translating into actual category rank movements, and to see whether competitors are gaining or losing ground in the same category.
The Annotations toggle and export options work the same way as in the Historical Visibility Chart.
After you finish
If you see a market on the Visibility Map where your score is significantly lower than competitors, open the Localization Performance tab to investigate whether localization coverage is contributing to the gap. See Measure localization impact on visibility.
If the Historical Visibility Chart shows a score drop that coincides with an app update, cross-reference that period in the ASO Report to see whether specific keyword rankings shifted at the same time.
Related links
Need more help?
If you have further questions on the process, contact your dedicated Customer Success Manager or contact the support team via live chat.