The Localization Performance tab in the Visibility Report shows how thoroughly your app and its competitors are localized across App Store storefronts, and how that localization coverage correlates with visibility scores by market.
This article explains how to read the three sections of the tab and what the data tells you.
To understand what visibility scores represent before you start, see About Visibility Report.
What the tab covers
Localization Performance has three sections.
Localization Performance Distribution shows how many countries each app reaches within each visibility score tier.
Localization Performance shows the same data in table form, one row per app, one column per score bracket.
Country Based Performance lists every storefront with visibility scores for each selected app side by side.
Localization Performance Distribution
The distribution chart is a grouped bar chart. The horizontal axis shows visibility score tiers: 0–20, 20–40, 40–60, 60–80, and 80–100. The vertical axis shows the number of countries. Each app is represented by a colored bar in each tier.
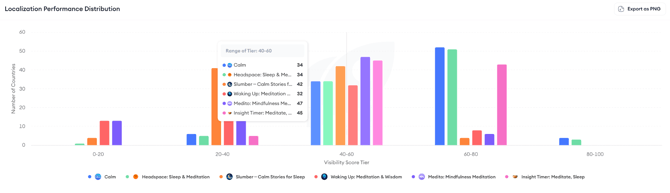
Hovering over any bar group opens a tooltip showing the exact country count for each app in that tier. An app with a large bar in the 80–100 tier is achieving high visibility across many storefronts, a signal that its localization and keyword strategy is working broadly. An app with most of its countries concentrated in the 0–20 or 20–40 tier has wide distribution but low visibility in most markets.
Click Export as PNG to save the chart as an image.
Localization Performance table
The table below the distribution chart shows the same data in a structured format. Each row is an app. The columns represent the same visibility score brackets. Each cell shows how many countries that app falls into for that bracket.
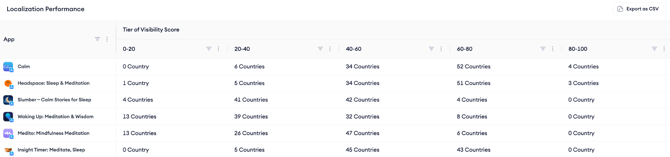
Use this table to compare your app against competitors across all tiers at once. If a competitor has significantly more countries in the 60–80 or 80–100 bracket than you do, that is a quantified gap to investigate, particularly in markets where you are present but underperforming.
Country Based Performance
The Country Based Performance table lists every App Store storefront as a row, with a visibility score column for each selected app. This lets you compare your score against competitors in every market simultaneously.
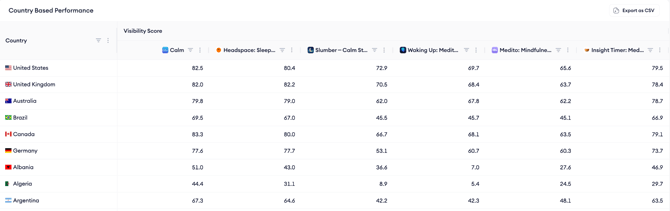
Sort by any app's column to find the storefronts where that app is strongest or weakest. If your score in a storefront is significantly below a competitor's, and that storefront is a priority market for you, that gap is a localization or keyword coverage opportunity worth investigating.
Click Export as CSV to download the full table for offline analysis.
After you finish
If Country Based Performance shows a market where your visibility is low relative to competitors, check whether your app is fully localized for that storefront, app name, subtitle, keyword field, screenshots, and description.
Markets where a competitor has a high score but you have low or no presence are the clearest localization opportunities.
Related links
Need more help?
If you have further questions on the process, contact your dedicated Customer Success Manager or contact the support team via live chat.