
The Budget Allocation page shows how budget is distributed across allocation groups and campaigns for one selected campaign group. You can use the page to review daily totals, track 30-day trends, check allocation group status, and open allocation group details.
Select a campaign group
The campaign group selector appears at the top right of the Budget Allocation page. The selected campaign group controls the data shown across the page.
When you first open the page, MobileAction selects the campaign group with the highest spend during the last 30 days.
To view another campaign group:
- Open the campaign group selector.
- Select a campaign group.
You can view only one campaign group at a time.
If you manage more than five campaign groups:
- Open the selector.
- Click View All.
- Search for a campaign group by name.
- Select it.
If your account has limited-access permissions, the selector shows only the campaign groups you are authorized to view.
Review the Daily Overview
The Daily Overview shows the previous day’s results across all running budget allocation groups in the selected campaign group.

The Daily Overview shows the previous day’s budget allocation totals for the selected campaign group.
All amounts use the campaign group’s currency.
The overview contains five values:
|
Value |
Meaning |
|
Active Budget Allocations |
The number of budget allocation groups currently running |
|
Campaigns in Allocations |
The number of campaigns included across the running allocation groups |
|
Total daily budget |
The combined daily budget of all running allocation groups |
|
Total spend |
The amount spent during the previous day across the running allocation groups |
|
Total daily budget consumption |
The percentage of the combined daily budget spent during the previous day |
Total daily budget consumption is calculated as:
Total Spend ÷ Total Daily Budget × 100
Read the daily budget consumption chart
The chart below the Daily Overview shows budget and spend trends for the selected campaign group. By default, it covers the last 30 days and includes only running budget allocation groups.
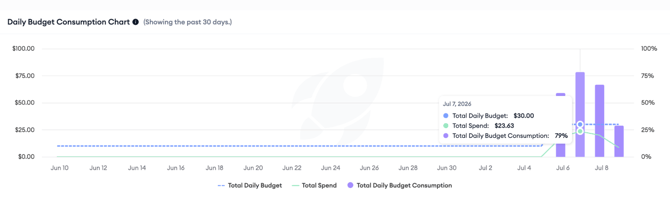
Hover over a date to view Total Daily Budget, Total Spend, and Total Daily Budget Consumption.
The chart displays:
- Total Daily Budget
- Total Spend
- Total Daily Budget Consumption
Hover over a point on the chart to view all three values for that date.
You can use the chart to check whether spend regularly falls below the available budget or increases on specific dates.
Use the Budget Allocation table
The table lists all budget allocation groups created for the selected campaign group. The most recently created allocation group appears first.
You can move between pages when the table contains more allocation groups than can be shown at once. The Budget Allocation name column remains pinned while you scroll horizontally.

The Budget Allocation table shows each allocation group’s status, schedule, budget, spend, consumption, KPI, goal, and attribution settings.
Budget Allocation
This column shows the name entered when the allocation group was created. You can search by allocation group name or sort the column alphabetically.
Status
This column shows whether the allocation group is currently distributing budget.
|
Status |
Meaning |
|
Running |
The allocation group is actively distributing budget |
|
Paused |
Budget distribution is temporarily stopped |
Use the toggle to pause or resume an allocation group.
Pausing a running allocation group requires confirmation. Resuming a paused allocation group takes effect immediately and does not require confirmation.
You can filter the table to show only:
- Running allocations
- Paused allocations
For instructions, see Edit, pause, resume, or delete a budget allocation group.
Budget Schedule
This column shows whether a budget schedule exists.
|
Value |
Meaning |
|
Active |
One or more schedules exist for the allocation group |
|
+ Schedule |
The daily-cap allocation group does not have a schedule |
|
N/A |
The allocation group uses a monthly cap, so Budget Scheduler is unavailable |
An Active status can represent a schedule that is currently running, upcoming, or completed. Click the edit icon beside Active to view or manage schedules. Click + Schedule to create one. For instructions, see Schedule daily budget changes.
Total Daily Budget
This column shows the allocation group’s current daily budget in the campaign group’s currency, and you can sort and filter it. If you update the daily budget, the change takes effect the following day.
Last Day’s Spend
This column shows how much the allocation group’s campaigns spent the previous day, and you can sort and filter it.
Daily Budget Consumption
This column shows the percentage of the daily budget spent during the previous day.
It is calculated as:
Last Day’s Spend ÷ Total Daily Budget × 100
The column also shows a badge.
|
Badge |
Consumption |
Meaning |
|
New |
Not applicable |
The allocation group was recently created. The badge disappears after its first full day of activity. |
|
High |
90%–100% |
Most of the daily budget was used. Consider increasing the daily budget if you want to scale further. |
|
Moderate |
41%–89% |
Part of the daily budget was used. Review the allocation group to determine whether changes could improve delivery. |
|
Low |
0%–40% |
A limited portion of the daily budget was used. Review the allocation group because a large portion of the available budget is going unused. |
You can sort and filter the column.
Budget Allocation KPI
This column shows the KPI selected for the allocation group:
- CPA
- CPI
- CPG
You can filter the table by KPI.
For KPI definitions, see About Budget Allocation KPIs, goals, and attribution settings.
Goal
This column shows the goal used by the allocation group.
|
KPI |
Goal shown |
|
CPA |
Installs |
|
CPI |
Attributed Installs |
|
CPG |
The goal selected when the allocation group was created |
Attribution Settings
This column shows the attribution configuration used by the allocation group.
|
KPI |
Information shown |
|
CPA |
A dash because attribution settings do not apply |
|
CPI |
Selected Attribution Type and Claim Type |
|
CPG |
Selected Attribution Type, Claim Type, Reporting Time, and Attribution Delay |
Details
Click the details icon at the end of a row to open the Budget Allocation Details page.
From the Details page, you can:
- Review the allocation group setup.
- View its performance.
- Edit supported settings.
- Delete the allocation group.
Click Back to return to the main Budget Allocation page.
Open allocation group details
The Overview section on the Budget Allocation Details page shows a read-only summary of:
- App
- KPI
- Goal
- Number of included campaigns
- Daily budget
- Cap type
- Budget Schedule status
Hover over the campaign count to view included campaign names.
MobileAction shows up to 10 campaign names. If the allocation group contains more than 10 campaigns, it shows the first 10 names and the number of additional campaigns.
The Budget Schedule field shows:
- The number of schedules created for a daily-cap allocation group.
- No schedule when a daily-cap allocation group has no schedules.
- N/A when the allocation group uses a monthly cap.
Click Edit to change the allocation group’s editable settings.
Review allocation group performance
The performance graph on the Details page shows:
- Total Daily Budget
- Total Spend
- Total Daily Budget Consumption
The graph uses the last 30 days by default.
Change the date range to review another period.
Related links
- Edit, pause, resume, or delete a budget allocation group
- How Budget Allocation redistributes campaign budgets
- Schedule daily budget changes
- Troubleshoot Budget Allocation
Need more help?
If you have further questions on the process, contact your dedicated Customer Success Manager or contact the support team via live chat.