Compass Trace shows KPI movement on a chart and highlights spikes that may need further review.
Check this article to understand how to read the chart, review spike points, add annotations, and investigate the activities behind KPI changes.
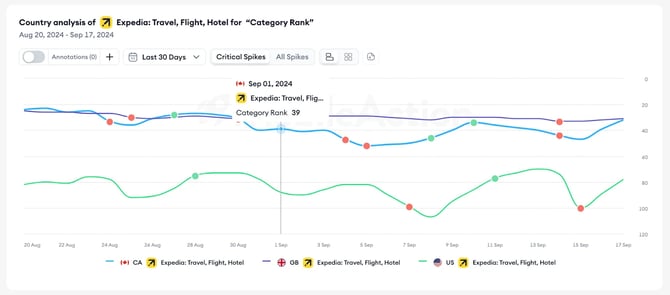
What the Trace chart shows
The Trace chart updates based on your selected setup.
The chart may reflect your selection:
- Main app
- Analysis type
- KPI or KPIs
- Competitors
- Countries or storefronts
- Date range
Use the chart to review how selected KPIs changed over time.
Red and green spike pointsTrace highlights spike points on the chart with colored dots.
- Red dots show negative movements.
- Green dots show positive movements.
These spike points help you find important KPI changes without reviewing the full chart manually.
Critical Spikes and All Spikes
You can switch between Critical Spikes and All Spikes.
Use Critical Spikes when you want to focus on the most important movements.
Use All Spikes when you want to review a broader set of KPI changes.
Change the date range
Use the date range selector to change the time period shown in the chart.
When you change the date range, Trace updates the chart based on the selected period.
Switch between chart and table views
You can change how Trace displays the data.
Use the chart view when you want to review KPI movement visually.
Use the table view when you want to review the data by date, country, storefront, or selected metric in a structured format.
Hover over the chart for details
Hover over the chart to view more details for a specific point.
Depending on the selected analysis, you may see details such as:
- Date
- Selected app
- Country or storefront
- KPI value
- KPI movement
Review activities behind a spike
You can select a spike point to review the activities connected to that KPI movement.
- Open Trace.
- Set up your KPI analysis.
- Review the chart.
- Select a red or green spike point.
- Review the Activities section below the chart.
The Activities section shows user acquisition activities around the selected spike. This helps you understand what may have happened before or near the KPI change.
Activity types
The Activities section may include activity types such as:
- App Updates
- Featured Apps
- In-App Events
- PPO
- Similar Apps
- Custom product pages
- ASA / Paid
- Ad Intel
- Keyword Ranking
- Keyword Popularity
Available activity types may change based on the selected app, country, storefront, date range, and available data.
Use AI Filtered Activities and All Activities
You can choose how much activity data you wish to review.
Use AI Filtered Activities when you want a focused view of activities that may be related to the selected spike.
Use All Activities to review all available activities in the timeline.
Add annotations
Annotations let you add notes to your Trace chart.
You can use annotations to record external events that may help explain KPI movement, such as:
- Marketing campaigns
- Social media trends
- Industry news
- Product launches
- Internal notes about performance changes
To add an annotation:
- Open Trace.
- Set up your KPI analysis.
- Select the + button next to Annotations.
- Add your note.
- Choose whether the annotation is for yourself or visible to your team.
Annotations help you connect KPI movement with known events, so you can review performance changes with more context later.
Export chart data
You can export Trace data to review it outside the MobileAction platform or to share reports.
- Set up your Trace analysis.
- Review the chart or table.
- Select Export as CSV.
- Download the file.
Use CSV export when you want to analyze data in a spreadsheet or for reporting workflows.
Related links
Need more help?
If you have questions about KPI charts, spike points, or activities in Trace, contact your Customer Success Manager or reach the support team through live chat.