Analytics Overview shows summary metrics for downloads, revenue, conversion funnel performance, organic performance, and keyword visibility.
The metrics you see may change depending on the selected app, store, country, date range, and connected integrations.
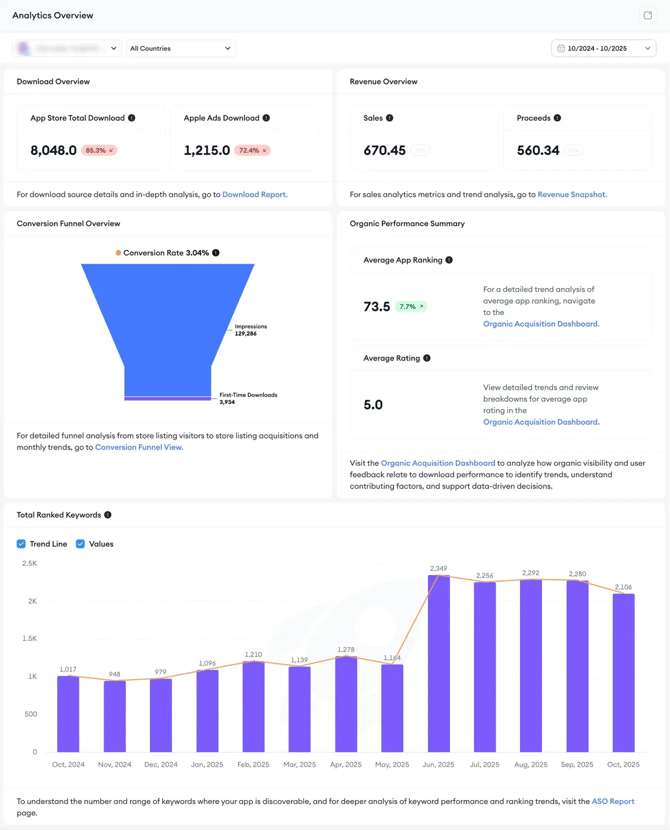
Download Overview metrics
Download Overview shows download performance for the selected app and filters.
|
Metric |
Description |
Availability |
|
App Store Total Download |
Total App Store downloads for the selected app, countries, and date range |
Available for App Store apps when App Store Connect data is connected |
|
Google Play Store Total Download |
Total Google Play Store downloads for the selected app, countries, and date range |
Available for Google Play Store apps when Google Play Console data is connected |
|
Apple Ads Download |
Downloads attributed to Apple Ads campaigns |
Available when Apple Ads data is connected |
If Apple Ads data is not connected, Apple Ads Download may be unavailable or shown as zero.
Revenue Overview metrics
Revenue Overview shows revenue-related data for the selected app and filters.
|
Metric |
Description |
Availability |
|
Sales |
Total sales amount for the selected App Store app and filters, before applicable deductions |
Available for App Store apps when sales data is connected |
|
Revenue |
Revenue amount for the selected Google Play Store app and filters |
Available for Google Play Store apps when Google Play Console data is connected |
|
Proceeds |
Net earnings after applicable store deductions |
Available when the proceeds data is provided by the connected store source |
Metric names may differ by store. For example, App Store apps may show Sales and Proceeds, while Google Play Store apps may show Revenue and Proceeds.
Conversion Funnel Overview metricsThe Conversion Funnel Overview shows how users move through store acquisition steps.
The funnel changes based on the selected store and available data.
App Store funnel metrics
|
Metric |
Description |
|
Impressions |
The number of times your app was shown or viewed, when available |
|
First-Time Downloads |
Downloads from users who downloaded the app for the first time |
|
Conversion Rate |
The percentage of users who moved from the available upper-funnel step to download, when enough data is available |
If impressions or another required funnel step is unavailable or zero, the conversion rate may show as 0.00%.
Google Play Store funnel metrics
|
Metric |
Description |
|
Store Listing Visitors |
Users who visited your Google Play Store listing |
|
Store Listing Acquisitions |
Users who installed the app after visiting your store listing |
|
Conversion Rate |
The percentage of store listing visitors who became store listing acquisitions |
Use this section to check whether store visibility or store listing traffic is converting into downloads or acquisitions.
Organic Performance Summary metrics
Organic Performance Summary shows organic visibility and rating signals.
|
Metric |
Description |
|
Average App Ranking |
Your app’s average ranking position across ranked keywords for the selected filters |
|
Average Rating |
Your app’s average star rating for the selected store data, when available |
A lower average app ranking number usually means a stronger ranking position. For example, an average ranking of 20 is better than an average ranking of 150.
If rating data is unavailable for the selected app, store, or date range, Average Rating may show as 0.0.
Total Ranked Keywords metric
Total Ranked Keywords shows how many keywords your app ranks for during the selected period.
|
Metric |
Description |
|
Total Ranked Keywords |
The total number of keywords where your app appears in search rankings for the selected filters |
Use this chart to understand whether your app’s keyword coverage is increasing, decreasing, or changing over time.
The chart includes:
|
Option |
Description |
|
Trend Line |
Shows the keyword trend over time |
|
Values |
Shows keyword count values on the chart |
Percentage change indicators
Some cards include a percentage change indicator next to the main metric.
This shows how the metric changed compared with the previous comparable period. A downward indicator means the metric decreased.
For ranking metrics, review the percentage change together with the actual ranking value. A lower ranking number usually means a stronger ranking position.
Data differences by store
Analytics Overview supports both App Store and Google Play Store data, but not every metric appears the same way for both stores.
|
Area |
App Store apps may show |
Google Play apps may show |
|
Downloads |
App Store Total Download, Apple Ads Download |
Google Play Store Total Download |
|
Revenue |
Sales, Proceeds |
Revenue, Proceeds |
|
Conversion funnel |
Impressions, First-Time Downloads |
Store Listing Visitors, Store Listing Acquisitions |
|
Organic performance |
Average App Ranking, Average Rating |
Average App Ranking, Average Rating |
|
Ranked keywords |
Total Ranked Keywords |
Total Ranked Keywords |
Related links
Need more help?
If you have questions about Analytics Overview, contact your Customer Success Manager or reach the support team through live chat.