Use Conversion Funnel View to review how your app moves from impressions to first-time downloads.
You can select an app, choose a market, set a date range, and choose how the data is grouped. Then, you can review the chart, funnel, monthly section, and table to understand changes in conversion performance.
For a general explanation of what the dashboard shows and how the funnel metrics work, see About Conversion Funnel View.
Before you begin
Before you begin, make sure at least one of these Analytics & Performance integrations is connected:
- How to integrate your App Store Connect account for Analytics & Performance reports
Connect App Store Connect to access App Store performance data in MobileAction. - How to integrate your Google Play Console account for Analytics & Performance reports
Connect Google Play Console to access Google Play performance data in MobileAction.
If you open Conversion Funnel View and see a landing page, complete one of these integrations first. After at least one integration is connected, you can proceed to the dashboard.
Instructions
1. Open Conversion Funnel View
Go to Store Analytics.
Select Conversion Funnel View.
When the landing page appears, complete the required integration.
After at least one integration is connected, go to the dashboard.
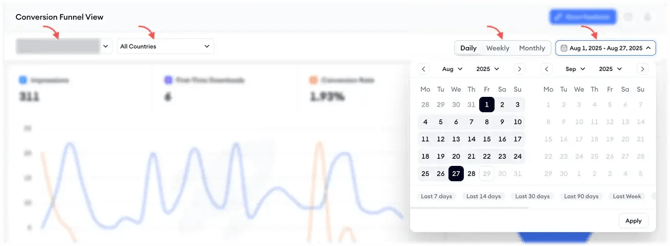
2. Set your analysis scope
Select the app you want to analyze.
Choose All Countries or select a specific market.
Pick your date range.
Choose how the data is grouped:
Daily
Weekly
Monthly
After you set these options, the dashboard shows funnel performance for your selected scope.
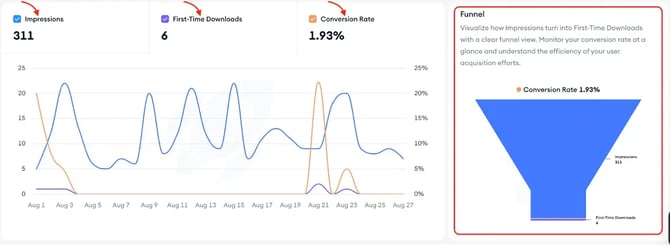
3. Read the top chart and funnel
Use the top chart to review your app’s funnel metrics for the selected date range.
You can hover over the chart to inspect daily values.
On the right, the funnel shows the journey from visibility to first-time downloads for your selected market and time period.
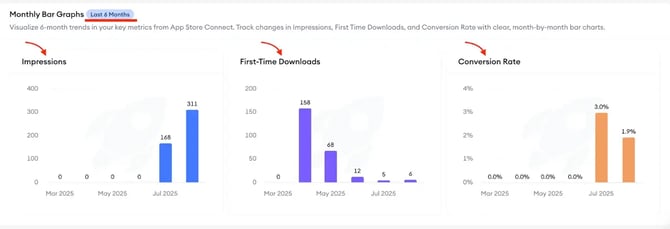
4. Review the monthly section
Scroll down to review the monthly section.
This section shows the main funnel metrics side by side for the last six months. Use it to spot longer-term trends, such as when visibility increased, downloads changed, or conversion rate improved or declined.
The monthly section covers the last six months and does not change based on your initial date selection.
5. Use the table view
Use the table view to review daily metrics in more detail.
You can use the table to find when an increase or a drop began.
You can sort the table by:
Highest impressions
Highest first-time downloads
Highest conversion rate
Lowest conversion rate
6. Export the table
You can export the table as a CSV.
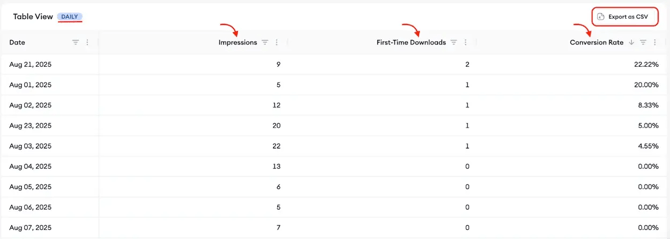
Use the CSV export when you want to share the data, include it in a report, or continue your analysis outside MobileAction.
Related links- About Conversion Funnel View
- Conversion Funnel View Overview
- Analytics Overview
- How to integrate your Google Play Console account for Analytics & Performance reports
- How to integrate your Google Play Console account for Analytics & Performance reports
Need more help?
If you have further questions on the process, contact your dedicated Customer Success Manager or contact the support team via live chat.