The Download Report dashboard provides a comprehensive view of your app’s download performance by consolidating data from Google Play Console, App Store Connect and Apple Ads through API-based integrations. This eliminates the need to juggle multiple dashboards and makes it easier to:
-
Monitor total downloads across organic and paid channels
-
View detailed source-level breakdowns (e.g., Search, Browse, App Referrer, Web Referrer)
-
Measure the impact of Apple Ads campaigns
-
Compare performance over time using date range comparisons
-
Segment analysis by country and app
-
Export data by day, week, or month to inform reporting or strategy sessions
Whether you're a growth marketer, performance analyst, or UA manager, this dashboard a centralized, reliable view to guide your decisions. Let's take a step-by-step look into the dashboard:
1- The page is split into three panels, giving you a full snapshot of downloads, sources, and day-by-day trends in one view.

2- Before diving in, pick the app and storefront you want to analyze; by default, the tool loads with all apps and all countries selected. Next, set the two date ranges you’d like to compare. This side-by-side view makes it simple to spot shifts in growth, seasonality, or campaign lift.

3- The first panel summarizes your key metrics: total App Store downloads, organic downloads, paid downloads, and if you’ve integrated your Apple Ads account, installs attributed to Apple Ads. A line graph directly beneath the metrics shows how each source performed on the specific day you’ve highlighted.

4- Scroll to the Source Details panel to see which channels drive the most installs. Here you’ll find a breakdown of every source contributing to your totals, giving immediate insight into where your acquisition mix is strongest (or weakest).
.png?width=600&height=252&name=source%20details%20(2).png)
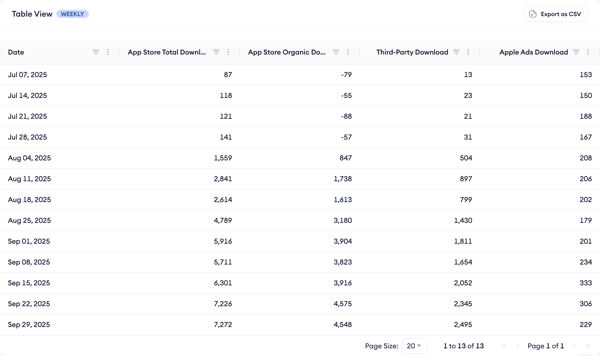
5- The final panel, Total View, lists daily download brackets for the entire period you selected. Each day’s organic, paid, and Apple Ads numbers sit side by side, making it easy to spot peaks, dips, and seasonal patterns at a glance.
What you need to access the page
To view and use the Download Report, you must integrate at least your App Store Connect account.
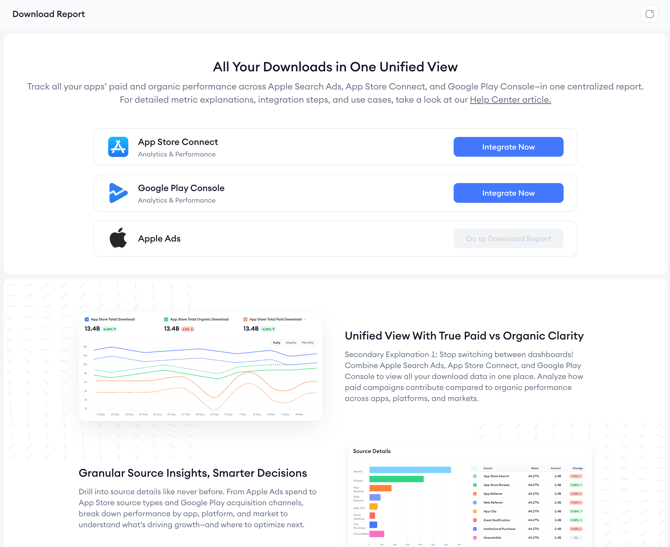
Integration requirements
To get the most out of the Download Report, you’ll need to integrate your Google Play Store, App Store Connect and Apple Ads accounts. Together, these integrations unlock a complete view of your app’s download performance, letting you monitor total downloads, compare paid and organic metrics side by side, and analyze traffic sources all in one place.
-
App Store Connect integration is required to access the dashboard.
-
Apple Ads integration is optional, but strongly recommended. Without it, paid download data and Apple Ads performance will not appear.
- Google Play Console integration is a must to see the Google Play Store data.
If you have:
-
Only Apple Ads: You’ll be prompted to integrate App Store Connect first.
-
Only App Store Connect: You can access the dashboard, but Apple Ads columns will show "N/A."
-
Both integrations complete: You’ll be directed straight into the dashboard.
Metric calculations
-
Apple Ads Download = Apple Ads Tap-through Installs
-
App Store Organic Download = App Store Download (Search +Browse) - Apple Ads Download
-
App Store Paid Download = App Store Total Download - App Store Organic Download
-
App Store Total Download = All downloads from all available sources (Search, Browse, App/Web Referrer, App Clip, Event Notification, Institutional Purchase, Unavailable)
Key use cases
1. Monitor download trends across time
Visualize how your app’s downloads are performing over time across all available sources with daily, weekly, or monthly granularity.
.png?width=670&height=278&name=Line%20Graph%20(4).png)
2. Deep-dive into download sources
Break down your download data by:
-
Search
-
Browse
-
App Referrer
-
Web Referrer
-
App Clip
-
Event Notification
-
Institutional Purchase
This allows you to identify which sources are contributing the most and where your campaigns or store presence may need optimization.
.png?width=670&height=282&name=source%20details%20(2).png)
3. Compare campaign or seasonality effects
Use the compare date range feature to see the impact of a specific campaign, event, or seasonal period. Solid and dashed lines represent different periods for quick trend spotting.
4. Simplify team reporting
Export full tables with key metrics for selected date ranges, perfect for monthly reports, presentations, or external analysis tools.
If you need help interpreting the numbers or setting up integrations, contact your Customer Success Manager or use our live chat!