SearchAds.com’s Ads Manager is a tool tailored to enhance your management of Apple Ads campaigns. From optimizing bids and managing keywords to automating tasks and accessing real-time insights, Ads Manager equips you with everything you need to boost your ad performance.

In this article, we'll cover Ads Manager's core functionalities and provide step-by-step instructions on how to set it up and utilize its features.
How to set up Ads Manager
Connecting your account and navigating the platform
Before managing your campaigns, you'll need to connect your Apple Ads account to SearchAds.com. Once connected, you can navigate the multi-layer system that includes:
Campaign Groups, Apps, Campaigns, Ad Groups, Keywords, Search Terms, Ads, Custom Product Pages (CPPs), Negative Keywords
Each layer is designed for easy navigation and management, allowing you to manage and monitor your ads and custom product pages in real-time.
Customizing the Ads Manager interface
The Ads Manager interface offers numerous filtering and editing options to customize your dashboard. By default, the platform displays critical metrics such as spend, impressions, taps, installs, tap-through rate, conversion rate, average CPA, strategies, and goals, although the available metrics may vary by layer. You can also create custom metrics, utilize cohort analysis metrics or utilize MMP metrics on the dashboard.
Here are the default metrics on Ads Manager available on every campaign level and what they mean;
.png?width=600&height=669&name=ads%20manager%20table%20(1).png)
You always have the flexibility to modify your dashboard. Here’s how:
-
Click on “Edit Columns” to add or remove metrics. This customization helps you track metrics crucial to your campaign's goals.

2. Organize and sort your data by clicking on the headers of each column. You can sort the data in ascending or descending order based on your preferences. You can also drag and drop the columns on the table to reorder according to your preferences.

Creating custom columns
You can create a custom column for any specific calculations you wish to see on your dashboard. You can sort the columns by clicking on the headers, which will arrange the data in either ascending or descending order. Drag and drop them to reorder.
1- Select “Edit Columns” in order to start your custom column creation process.

2- Scroll down to the end, and click on “New Custom Column”.

3- Once you’ve completed the 2nd step, the window below will be shown on your screen. Among the options, you can select which type of custom column you would like to create.
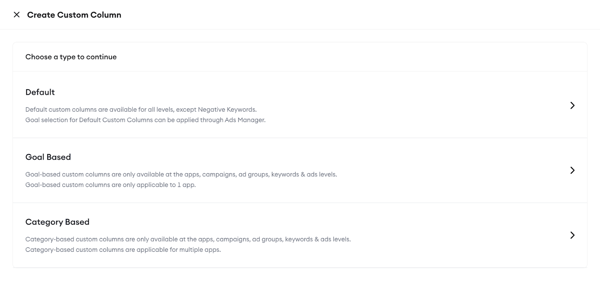
4- Depending on your custom column type, you can select add metrics, numbers or operators to write down your own formula. After that, choose under which levels you want this custom column applied. Then name your column, choose your format and write a description to prevent future misunderstandings. Once you are sure of every entity, click Create to see it on your dashboard.

Analyzing performance with graphs and tables
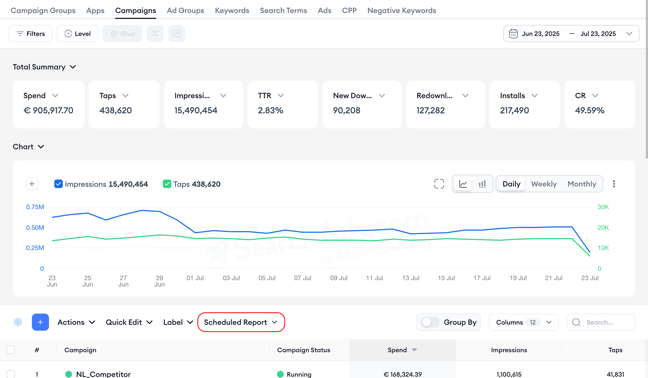
Above your main table, a dynamic graph displays historical data for your chosen metrics. Default metrics include impressions and taps, but you can adjust this via the control bar above the graph. Key features include:
- Above the graph, the summary table lets you select and view various metrics, focusing on the KPIs essential to your campaign. To adjust the view according to your needs, all you need to do is click on the metric names on the right-hand side and choose from the dropdown menu. For the graph metrics, you should click on the field with removable metric names on the left-hand side and select the metrics you’d like to check in the chart view from the dropdown menu.

You can save your filter for further use by clicking on the “Save Filter” button and giving your customized view a name.

You can always access your filter by clicking on the “Filters” button and finding the Saved Filters option in the menu.

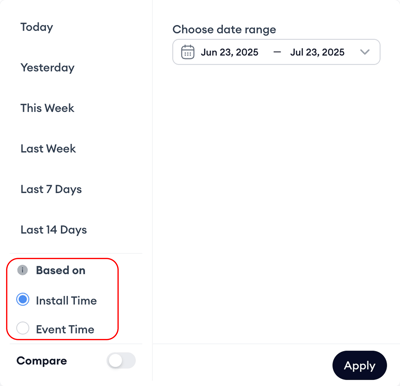
While choosing the dates you want to analyze, you can also choose to compare two time periods and see how your performance was affected during that specific time period. All you need to do is switch on the "Compare" toggle and choose the time intervals you want to compare.

While choosing the time intervals, you can automatically choose to compare the "previous period" or "previous year" by clicking on those labels.
When you click "Apply," your dashboard will automatically put green or red tags next to each performance metric.
Keep in mind that a green tag does not necessarily mean an increase, and a red tag does not necessarily mean a decrease; it shows whether the change is positive or negative.
%201.png?width=664&height=387&name=searchads.mobileaction.co_dashboard_campaigns%20(12)%201.png)

In addition to the table viewing option "compare," you can also check the comparing metrics along with the green and red tags on the table. Once you select your comparing dates, your chart on the Ads Manager will be able to give you instant snapshots of your metrics.

Scheduling reports
You can set up scheduled reports to take your reporting/analysis capabilities to the next level. By setting a frequency-time frame and where and how you’d like to get your reports, our system will automatically create your reports and send them to you. Here is how you can do that for the best results:
1- On top of the table part of your Ads Manager, find “Scheduled Reports” as a button. Click on it to start deciding on the settings of your scheduled reports.
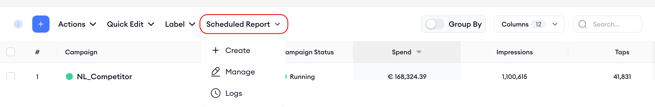
2- Once you click “Scheduled Reports,” you’ll see a dropdown menu, giving you 3 options: Create, Manage, and Logs. If this is your first time creating a scheduled report, click Create. Keep in mind that you can easily manage and see the logs showcasing the historical actions taken for any scheduled report by clicking Logs here on your Ads Manager as well.
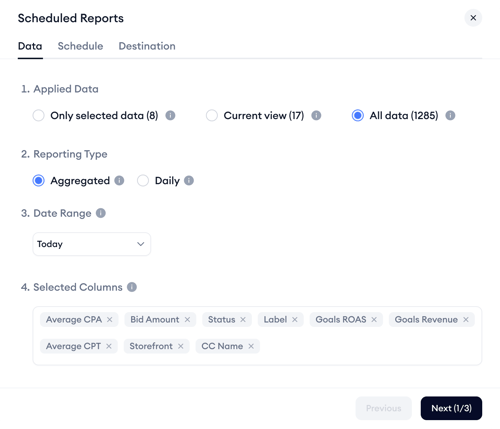
3- After clicking Create, a pop-up window will open on your screen. The first step of your Scheduled Reports creation process is deciding on the data you’d like to get the reports for. You have 3 options:
-
Select row by row to create a custom data set, and then get the scheduled reports for this selected data set.
-
Get the reports for the current data set you see before starting the scheduled reports creation process.
-
Get the reports for all data you have.
The second data-related element you need to set is the reporting type. You can get your reports in an aggregated data format. If you choose this type, we aggregate metrics for the selected period and provide 1 row for each item. Or you can choose to get your reports daily. If you choose this type, we report metrics in daily granularity for the selected period and provide 1 row for each day.
The next thing you need to decide is the date range. Choose the date range to include data in your report.
Lastly, for the data section, select the columns (metrics) you’d like to include in your reports. This section allows you to remove columns; however, adding columns here is not possible. Please use Ads Manager to add columns.
4- After you are done with the data set selection, you need to decide on the schedule by switching to the Schedule tab.
Within this tab, decide the frequency you’d like to get the reports. If you select “Run report on specific days & times,” a timing sheet will open in your pop-up screen, allowing you to customize the specific times you’d like to get the reports.
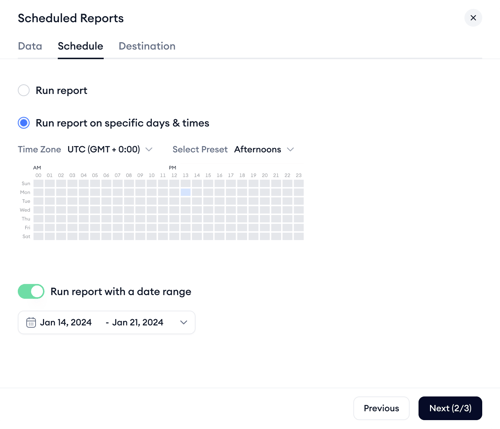
You can also select a date range to receive the reports within a selected time frame. If you choose this option, you’ll get the reports at your selected frequency starting from your start date, and our system will automatically stop sending your reports on your selected end date.

The last tab you must decide on before setting up your scheduled reports is the Destination tab. You can get your reports via Email or Slack, and currently only in CSV format. Also, before finalizing, this is where you need to name your reports for better analysis.

Multi-layered campaign management
You can also manage different layers of your Apple Ads campaigns directly on the platform. Here’s how;
To start a new campaign, click the “Create” button in the Campaigns layer, choose a campaign group, select the app and ad placement, and set your budget to create your campaigns.

This action opens a page where you select the campaign group under which you wish to organize the new campaign(s). This step is crucial for setting different access levels for users if needed.
On the same page, you need to select the app and ad placements. Then, proceed on the next page with the rest of the campaign settings. Once these settings are complete, your campaign will be active and ready to run.

Creating a campaign is just one of the actions you can take through the Ads Manager interface. If you click on the Actions button, you’ll find actions you can take according to the layer you’re on.
If you want to make changes quickly to your campaign on the Ads Manager interface, all you need to do is click on the Quick Edit button. The platform will let you edit the daily budget, country or region, and the name of the campaign, but just like the Actions button, the edits you can make changes depending on the layer you’re on.

Additionally, you can add automations for your campaigns by clicking on the Add Automation Rule+ button in the same line as the Create button. When you click on the Add Automation Rule+ button, you’ll be redirected to the Automations tool, where you’ll find 20+ templates built for your specific needs and multi-layer automation options.
To review historical data on campaign budgets, ad spend, and other related metrics, click on the graph icon next to the campaign budget field.


By simply clicking the edit button under the ad group name, you can manage your ad groups by configuring keyword bids and customizing demographics directly within the Ad Groups layer.
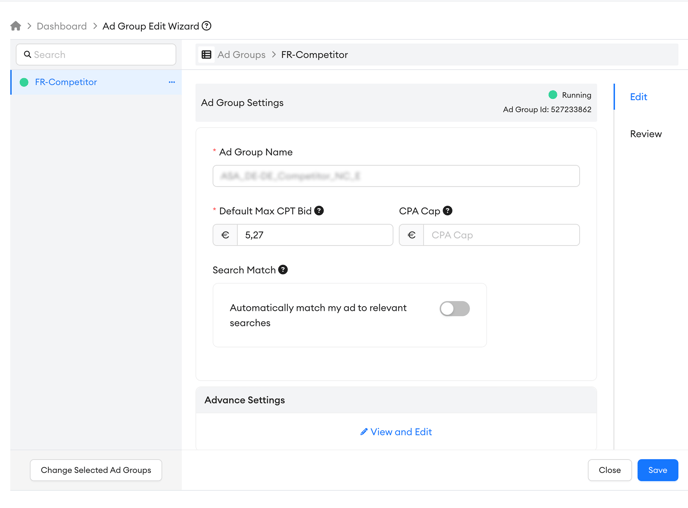
You will notice a column named “Strategies’' which indicates whether an automation or Smart Bidding activities are enabled for a specific ad group. This information is also accessible on other layers, providing a comprehensive view of the bidding strategies in use across different layers of your advertising efforts.

In the Keyword layer, you can manually adjust keyword bids, and in the Search Terms layer, you can view search terms along with Apple's Share of Voice data. This data helps you understand the distribution of impressions among these terms, offering insights into how much share your ads are getting compared to competitors.

Add and manage negative keywords from the Negative Keywords tab to refine your targeting and improve campaign performance, ensuring that your ads do not bid on unwanted terms. This functionality allows you to exclude specific terms that you do not want your ads to bid on, ensuring more targeted ad placement and improved campaign performance.

Additionally, if you have previously added any negative keywords, you can easily find and manage them within this layer.
Monitor your custom product pages' performance on the CPP layer of the dashboard. Compare performance metrics along with the assets that have been used.
.png?width=654&height=487&name=cpp%20(1).png)
Bulk actions in campaign management
Managing large-scale Apple Ads campaigns often requires efficiency and consistency. With Ads Manager’s bulk actions, you can quickly perform mass edits and updates across different layers, saving valuable time and reducing manual work.

You can access the Actions dropdown in each layer’s tab to manage multiple items simultaneously:
| Layer | Available Bulk Actions |
|---|---|
| Campaign Groups | Activate, Pause, Edit, Delete, Duplicate, Upload/Download Data, Show Funnel, Rule |
| Campaigns | Activate, Pause, Edit, Delete, Duplicate, Update Keyword Bids, Upload/Download Data, Show Funnel, Rule |
| Ad Groups | Activate, Pause, Edit, Delete, Duplicate, Update Keyword Bids, Upload/Download Data, Show Funnel, Rule |
| Keywords | Activate, Pause, Track, Copy, Update Keyword Bids, Upload Keywords, Download Data, Show Funnel, Automation Cart, Rule |
| Search Terms | Add as Keywords, Add as Negative Keywords, Copy Selected Terms, Download Data |
| Ads | Activate, Pause, Download Data, Compare Items |
| CPP | Download Data, Compare Items |
| Negative Keywords | Delete, Copy Selected, Copy All, Upload, Download Data |
How to perform bulk actions
-
Select items: Use the checkboxes next to each row to select multiple items in the table view.
-
Open the actions menu: Click on the Actions dropdown to see the available options for the selected level.
-
Choose your action: Whether you want to update bids, upload new items, or download campaign data, simply select the relevant action from the menu.
-
Confirm and apply: Follow the on-screen steps (if applicable) to confirm your changes. Actions like uploads or edits may prompt you to review your inputs before saving.
Segmenting data for deeper analysis
To help you better analyze and compare Apple Ads performance, Ads Manager supports data segmentation in pivot table view.

With this functionality, you can break down your campaign data by various dimensions such as campaign structure, targeting options, and time. Instead of seeing a single aggregated row per campaign or ad group, you’ll now be able to view your metrics across multiple layers, providing deeper insight into what’s driving performance.
You can segment by:
Campaign structure
-
Campaign Group – Analyze performance at the group level.
-
App Name – View results for each app across campaigns.
-
Campaign Name – Drill down into individual campaign performance.
Targeting
-
Storefront – Understand how different markets are performing.
-
Label – Compare performance by custom labels.
-
Ad Placement – Identify which placements are most effective.
-
Campaign Type – Separate brand, generic, and competitor campaign data.
Time
-
Day, Week, or Month – Spot patterns and trends over time.
You can combine multiple segmentation layers, for example, break down performance by Campaign Name, then further by Storefront, and finally by Day. This multi-dimensional view helps you uncover more granular insights and take action faster.
Tip: Segmentation works seamlessly with filters. Apply filters for specific campaigns, ad placements, or storefronts to focus only on the data that matters most to your analysis. Click “Add Group” to layer additional dimensions and fine-tune your segmentation view.
Conclusion
Ads Manager is designed to streamline your marketing efforts on Apple Ads. By following this guide, you can fully utilize the tool’s functionalities, making your ad management process more effective and results-driven.
If you have further questions or need assistance, don’t hesitate to contact your dedicated Customer Success Manager or get in touch with us via live chat.